Some examples of our work
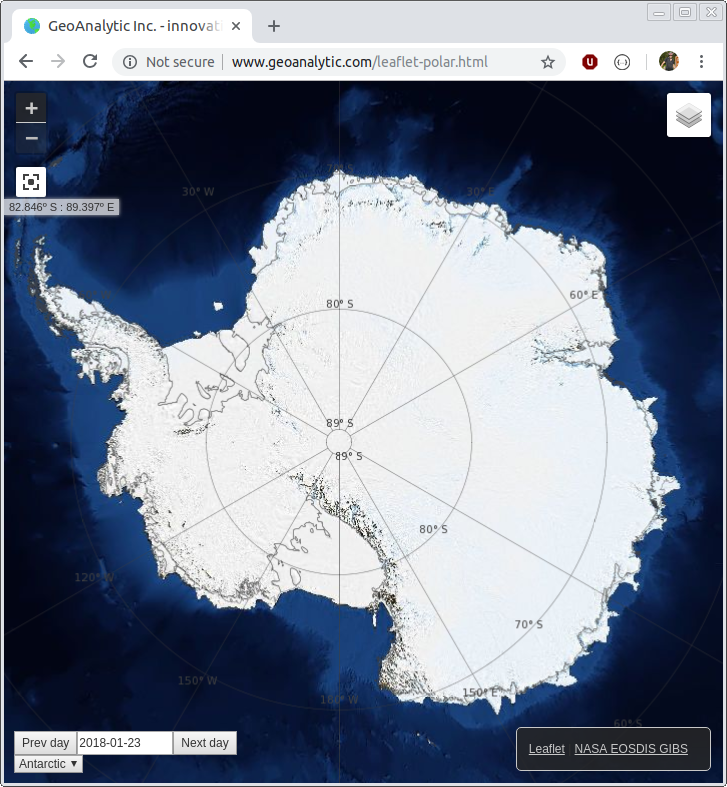
Web Mapping - Polar Projections
Most web mapping examples use a mercator projection, ususally the one mandated by google maps. This is not very useful for work in polar regions. This example illustrates how the Leaflet.js library can be used with a polar stereographic projection. The image data is provided by NASA, with daily image mosaics of both the Arctic and Antarctic regions.

Image Analysis - Greenland Sea
Satellite image analysis of offshore ice features.
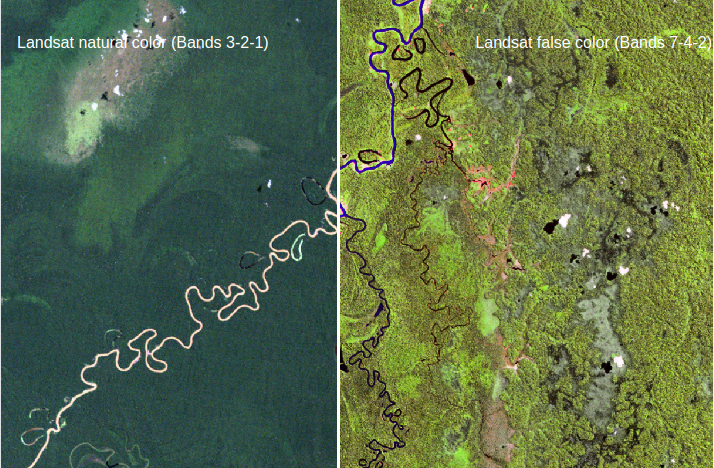
Multispectral Image Comparison
Explore how multispectral imagery can be used to present different terrain features with color.

Image Analysis - Canadian Arctic
Satellite image analysis of open water features in the Canadian Arctic.

Data as a Service - Arctic Engineering
Data as a Service (DaaS) For Arctic Engineering